
WTI crude oil (CL) futures have surged over 20% in the past month to front-month levels near $112 per barrel, propelled by escalating Middle East tensions and supply disruption fears that pushed intraday highs above $115 before a pullback on potential ceasefire reports. This volatility reflects trader consensus on near-term tightness amid OPEC+'s April production increase of 206,000 barrels per day and recent U.S. inventory builds exceeding 5 million barrels for the week ending March 27. The futures curve in backwardation signals premium on prompt supply, but June 2026 contracts trade around $98, implying expectations of demand softening. Key catalysts ahead include weekly EIA inventory reports through June 30, the OPEC+ ministerial meeting on June 7, and global economic data influencing consumption trends.
Experimental AI-generated summary referencing Polymarket data · UpdatedWill Crude Oil (CL) hit__ by end of June?
Will Crude Oil (CL) hit__ by end of June?
$7,574,303 Vol.
↑ $200
10%
↑ $175
12%
↑ $150
27%
↑ $140
40%
↑ $130
55%
↑ $120
75%
↑ $115
84%
↓ $85
56%
↓ $80
41%
↓ $70
23%
↓ $60
9%
↓ $55
7%
↓ $52
4%
↓ $50
3%
↓ $47
3%
↓ $45
2%
↓ $40
2%
↓ $35
1%
$7,574,303 Vol.
↑ $200
10%
↑ $175
12%
↑ $150
27%
↑ $140
40%
↑ $130
55%
↑ $120
75%
↑ $115
84%
↓ $85
56%
↓ $80
41%
↓ $70
23%
↓ $60
9%
↓ $55
7%
↓ $52
4%
↓ $50
3%
↓ $47
3%
↓ $45
2%
↓ $40
2%
↓ $35
1%
For CME Crude Oil (CL) futures contracts, the active month is the nearest of the contract months listed. The active month becomes a non-active month effective two business days prior to the spot month expiration. For example; if the spot month expires on a Friday the next listed contract will be considered the Active Month on the Wednesday prior to the spot month expiration.
Only the Active Month's official settlement price published by CME Group will be considered. Intraday trades, highs, lows, bids, offers, midpoint values, or indicative prices do not count.
Note that the settlement price may differ from the last traded price. CME's methodology to determine the settlement price can vary by commodity and contract.
Only days on which CME publishes an official settlement price for the Active Month will be included. Days without settlement prices (weekends, holidays, or market closures) are ignored.
This market will resolve based on the settlement price as it appears on the CME settlement page at the time it is first published for that trading day, regardless of any later corrections or updates.
The resolution source for this market is the CME Group website — specifically, the daily "Settlement" price for the Active Month of Crude Oil (CL) futures.
Market Opened: Mar 3, 2026, 3:47 PM ET
Resolver
0x65070BE91...For CME Crude Oil (CL) futures contracts, the active month is the nearest of the contract months listed. The active month becomes a non-active month effective two business days prior to the spot month expiration. For example; if the spot month expires on a Friday the next listed contract will be considered the Active Month on the Wednesday prior to the spot month expiration.
Only the Active Month's official settlement price published by CME Group will be considered. Intraday trades, highs, lows, bids, offers, midpoint values, or indicative prices do not count.
Note that the settlement price may differ from the last traded price. CME's methodology to determine the settlement price can vary by commodity and contract.
Only days on which CME publishes an official settlement price for the Active Month will be included. Days without settlement prices (weekends, holidays, or market closures) are ignored.
This market will resolve based on the settlement price as it appears on the CME settlement page at the time it is first published for that trading day, regardless of any later corrections or updates.
The resolution source for this market is the CME Group website — specifically, the daily "Settlement" price for the Active Month of Crude Oil (CL) futures.
Resolver
0x65070BE91...WTI crude oil (CL) futures have surged over 20% in the past month to front-month levels near $112 per barrel, propelled by escalating Middle East tensions and supply disruption fears that pushed intraday highs above $115 before a pullback on potential ceasefire reports. This volatility reflects trader consensus on near-term tightness amid OPEC+'s April production increase of 206,000 barrels per day and recent U.S. inventory builds exceeding 5 million barrels for the week ending March 27. The futures curve in backwardation signals premium on prompt supply, but June 2026 contracts trade around $98, implying expectations of demand softening. Key catalysts ahead include weekly EIA inventory reports through June 30, the OPEC+ ministerial meeting on June 7, and global economic data influencing consumption trends.
Experimental AI-generated summary referencing Polymarket data · Updated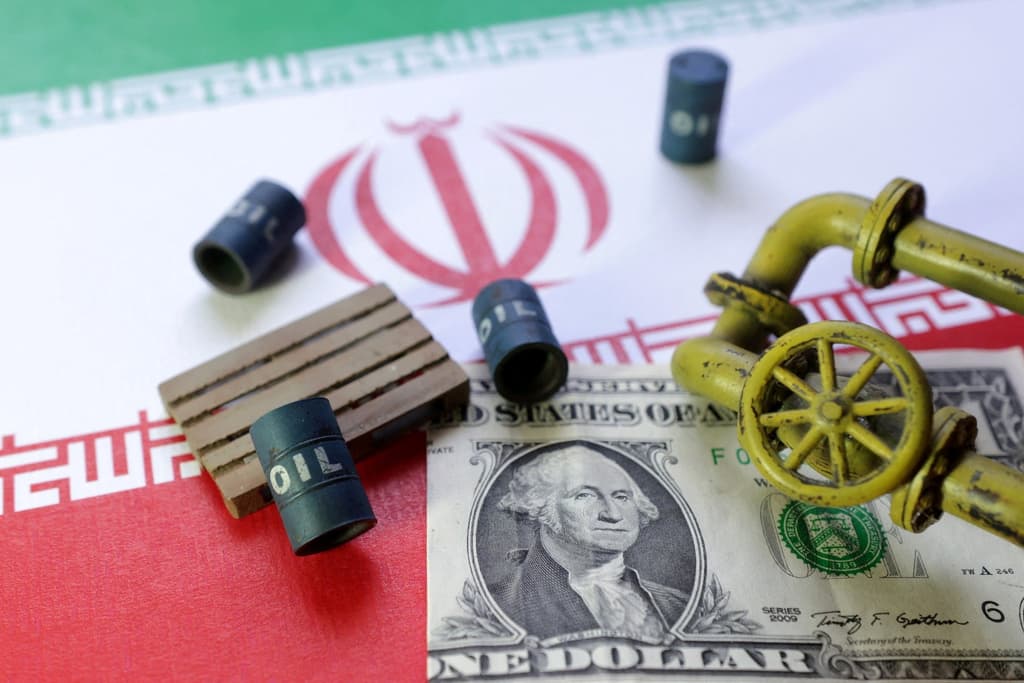


Beware of external links.
Beware of external links.
Frequently Asked Questions