

Profit/Loss
Past Day

Will Anthropic announce bankruptcy by December 31, 2027?
89.7¢
90.5¢
Will Anthropic announce bankruptcy by December 31, 2027?
Iran Nuke before 2027?
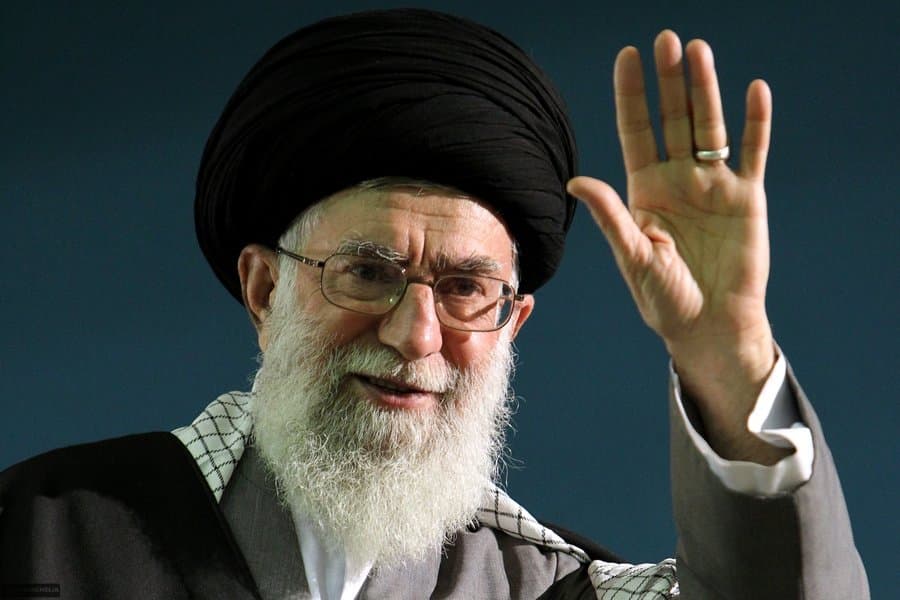
Will Mojtaba Khamenei be head of state in Iran end of 2026?
77.3¢
85.6¢
Will Mojtaba Khamenei be head of state in Iran end of 2026?
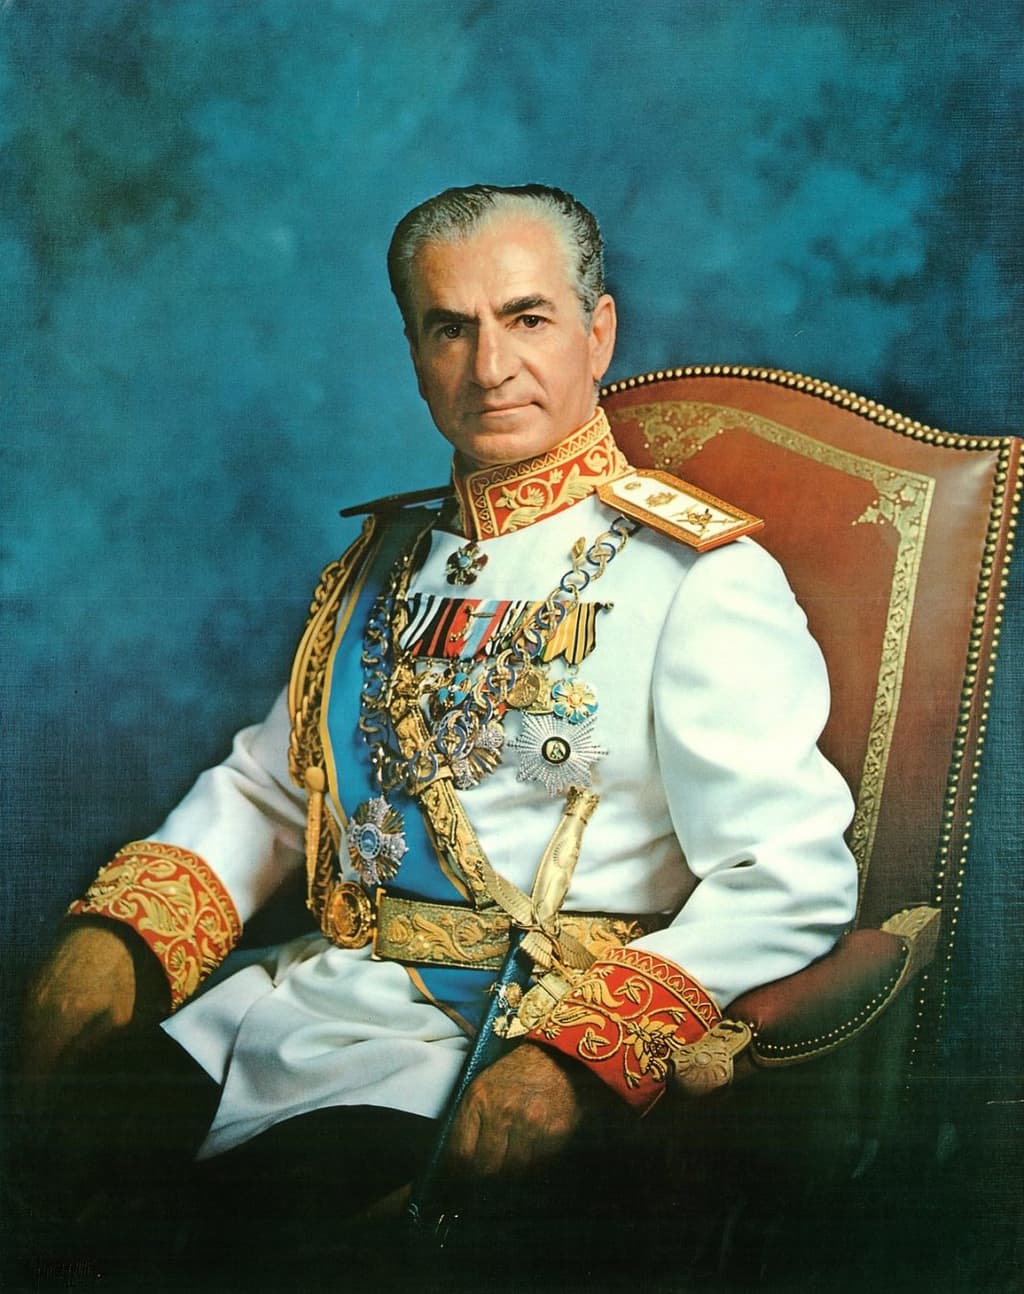
US recognizes Reza Pahlavi as leader of Iran in 2026?
81¢
96.4¢
US recognizes Reza Pahlavi as leader of Iran in 2026?

Israel accuses Iran/proxies of plane stabbing incident by Oct 31?
83.3¢
97.1¢
Israel accuses Iran/proxies of plane stabbing incident by Oct 31?
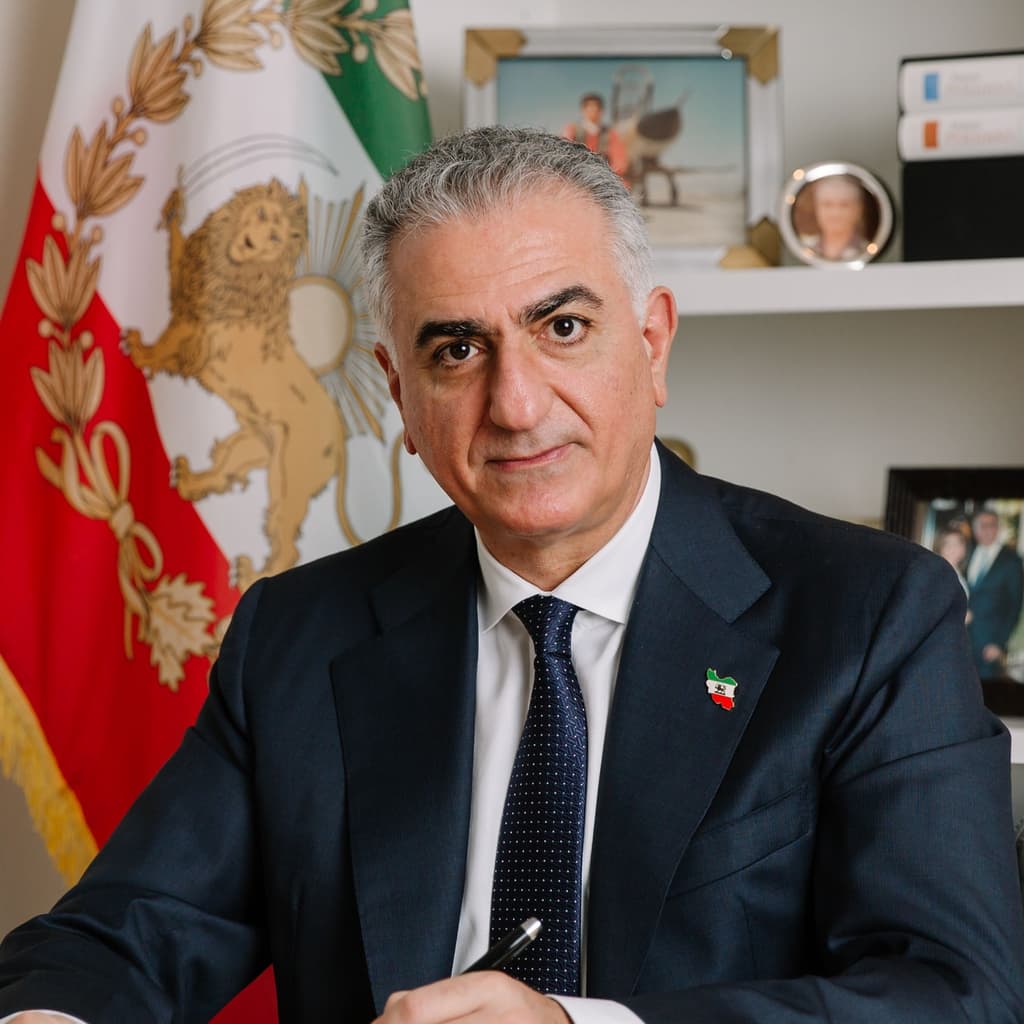
Will Reza Pahlavi enter Iran by December 31?

US announces end of Iranian blockade by December 31, 2026?
41.4¢
64.5¢
US announces end of Iranian blockade by December 31, 2026?

US x Iran ceasefire continues through October 22?
89.9¢
98¢
US x Iran ceasefire continues through October 22?

Will Trump recognize Somaliland before 2027?
73.3¢
97¢
Will Trump recognize Somaliland before 2027?

Israel x Turkey military clash before 2027?
86.4¢
90.5¢
Israel x Turkey military clash before 2027?
US announces end of Iranian blockade by October 31, 2026?
89.4¢
92.5¢
US announces end of Iranian blockade by October 31, 2026?

Will the Iranian regime fall before 2027?
82.6¢
94.5¢
Will the Iranian regime fall before 2027?

Will Iran withdraw from the NPT before 2027?
84.3¢
88¢
Will Iran withdraw from the NPT before 2027?

China x Taiwan military clash before 2027?
81.3¢
96.4¢
China x Taiwan military clash before 2027?
US x Iran ceasefire continues through October 31?
73.2¢
77.5¢
US x Iran ceasefire continues through October 31?

Russia x Ukraine ceasefire by December 31, 2026?
85.5¢
86.5¢
Russia x Ukraine ceasefire by December 31, 2026?

US obtains Iranian enriched uranium by December 31?
75.4¢
96.5¢
US obtains Iranian enriched uranium by December 31?

Putin out as President of Russia by December 31, 2026?
87.5¢
98.1¢
Putin out as President of Russia by December 31, 2026?

Israel withdraws from Lebanon by December 31, 2026?
79.4¢
97.2¢
Israel withdraws from Lebanon by December 31, 2026?

Pete Hegseth out as Secretary of Defense by December 31?
65.3¢
82.5¢
Pete Hegseth out as Secretary of Defense by December 31?