
Rr55
Bet small, panic big
$58.7K
Positions Value
$3,678.86
Biggest Win
2,890
Markets Traded
- Total PnL
- +$39.4K
- Total Volume
- 5.8M
Profit/Loss
Past Day

Will Google have the best AI model at the end of December 2026?
21.9¢
76¢
Will Google have the best AI model at the end of December 2026?

Will two SpaceX Starships dock together by December 31, 2026?
94.6¢
96.3¢
Will two SpaceX Starships dock together by December 31, 2026?
Will Google have the best AI model at the end of November 2026?
54.3¢
77.5¢
Will Google have the best AI model at the end of November 2026?

Will Jonathan Kreiss-Tomkins win the 2026 Alaska governor election?
64.8¢
99.6¢
Will Jonathan Kreiss-Tomkins win the 2026 Alaska governor election?

Trump out as President before 2027?

Will Mary Peltola win the Alaska Senate race in 2026?
96.3¢
98.7¢
Will Mary Peltola win the Alaska Senate race in 2026?
98.7¢
98.4¢

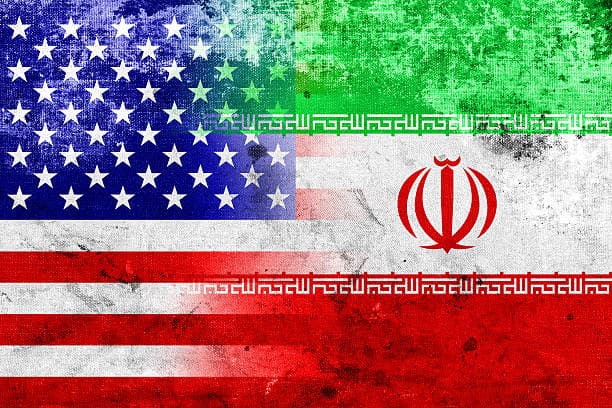
Will the U.S. invade Iran before 2027?

AI bubble burst in 2026?
93.6¢
97.1¢


Will the Iranian regime fall before 2027?

Will any AI model reach 1600 Math Arena Score by December 31, 2026?
84.6¢
95.6¢
Will any AI model reach 1600 Math Arena Score by December 31, 2026?

Will Chuck Schumer be the next Senate Majority Leader?
36.9¢
89.5¢
Will Chuck Schumer be the next Senate Majority Leader?

Will Dan Sullivan win the Alaska Senate race in 2026?
95.8¢
98.6¢
Will Dan Sullivan win the Alaska Senate race in 2026?
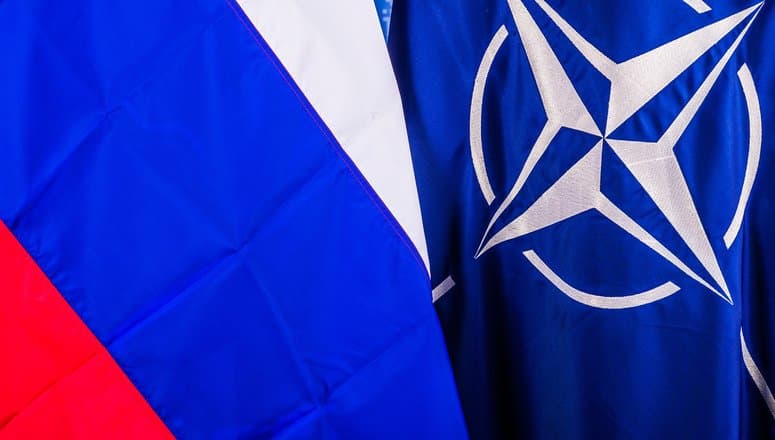
NATO x Russia military clash by December 31, 2026?
85.8¢
89.5¢
NATO x Russia military clash by December 31, 2026?
NATO x Russia military clash by November 15, 2026?
96.8¢
99.2¢
NATO x Russia military clash by November 15, 2026?

Xi Jinping out before 2027?
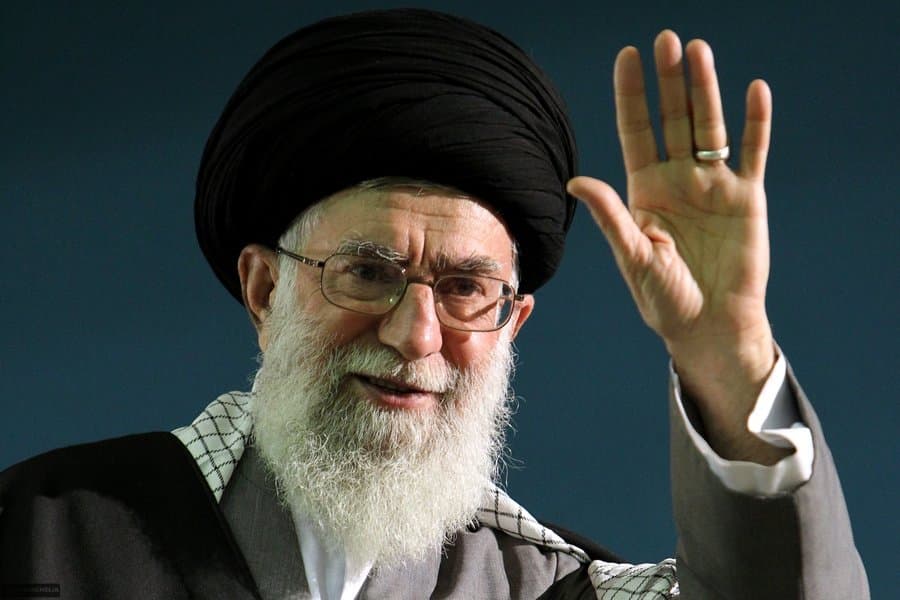
Will Mojtaba Khamenei be head of state in Iran end of 2026?
85.2¢
93.6¢
Will Mojtaba Khamenei be head of state in Iran end of 2026?

Will Benjamin Netanyahu be the next Prime Minister of Israel?
76.1¢
78.5¢
Will Benjamin Netanyahu be the next Prime Minister of Israel?

Will Anthropic have the best AI model at the end of December 2026?
55.9¢
21¢
Will Anthropic have the best AI model at the end of December 2026?