
Profit/Loss
Past Day
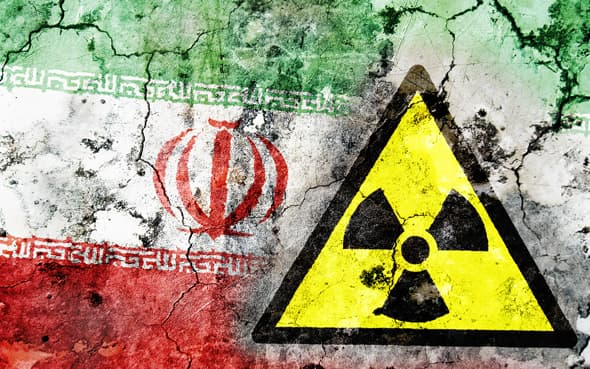
Iran Nuke before 2027?

Will Marco Rubio win the 2028 Republican presidential nomination?
26.9¢
19.9¢
Will Marco Rubio win the 2028 Republican presidential nomination?

Will Magdalena Andersson be the next Prime Minister of Sweden?
88.2¢
70.5¢
Will Magdalena Andersson be the next Prime Minister of Sweden?

Will Likud win 35 or more seats in the 2026 Israeli legislative election?
98.8¢
100¢
Will Likud win 35 or more seats in the 2026 Israeli legislative election?
Will Likud win the most seats in the 2026 Israeli legislative election?
98¢
99.3¢
Will Likud win the most seats in the 2026 Israeli legislative election?
Will Likud win 25-29 seats in the 2026 Israeli legislative election?
98.4¢
98.9¢
Will Likud win 25-29 seats in the 2026 Israeli legislative election?

Will Delcy Rodríguez be the de facto leader of Venezuela at the end of 2026?
94.5¢
94.3¢
Will Delcy Rodríguez be the de facto leader of Venezuela at the end of 2026?
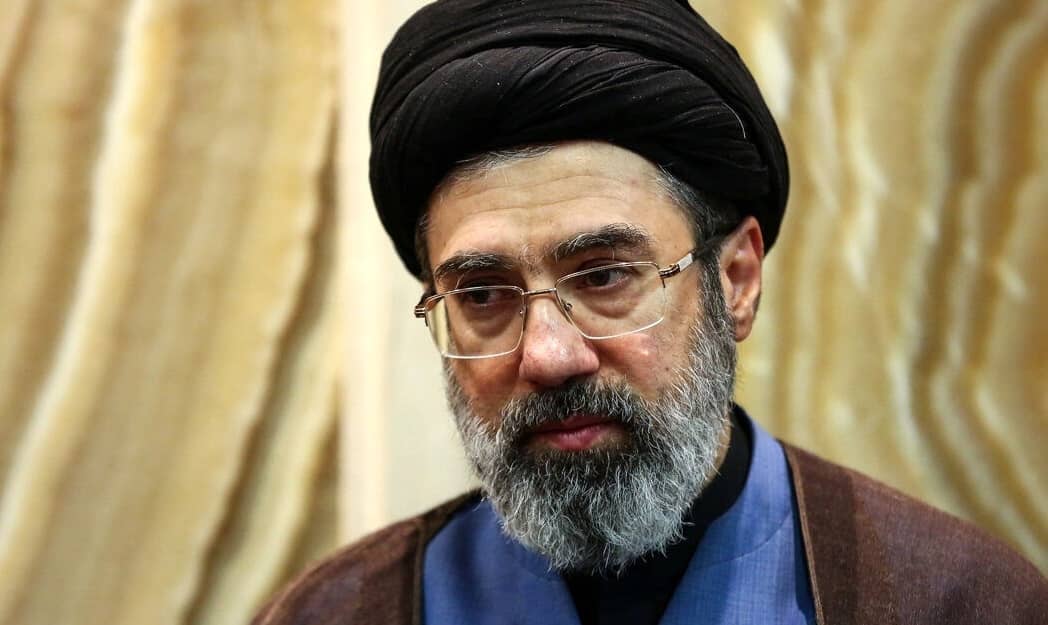
Iran leadership change by December 31?

Will Naftali Bennett be the next Prime Minister of Israel?
6.9¢
5.1¢
Will Naftali Bennett be the next Prime Minister of Israel?
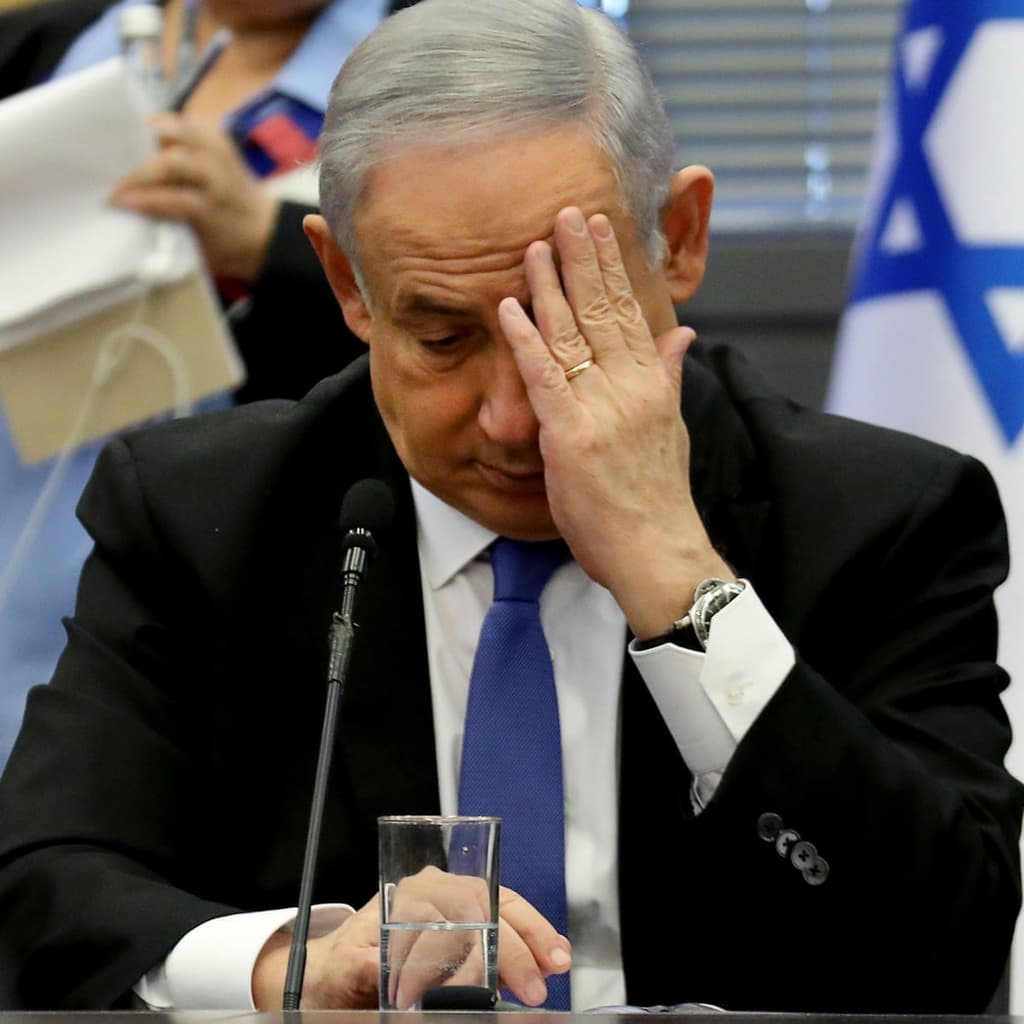
Netanyahu out by end of 2026?

Will voter turnout be 74% or higher in the 2026 Israeli legislative election?
98.9¢
99.4¢
Will voter turnout be 74% or higher in the 2026 Israeli legislative election?

Israel x Iran ceasefire continues through November 15?
24¢
35¢
Israel x Iran ceasefire continues through November 15?

Will Avigdor Lieberman be the next Prime Minister of Israel?
2.2¢
3.3¢
Will Avigdor Lieberman be the next Prime Minister of Israel?
Iran leadership change by November 30?

Will Together win the third-most seats in the 2026 Israeli legislative election?
77.2¢
99.1¢
Will Together win the third-most seats in the 2026 Israeli legislative election?
Iran leadership change by June 30, 2027?

Israeli election results in a hung parliament?
Will Nicolás Maduro be the leader of Venezuela end of 2026?
46.3¢
16.4¢
Will Nicolás Maduro be the leader of Venezuela end of 2026?

Will Benny Gantz be the next Israeli Minister of Defense?
99¢
99.9¢
Will Benny Gantz be the next Israeli Minister of Defense?

Will Donald Trump visit Israel in 2026?